Quick Answer
Modeled from typical utility rates and industry benchmarks, evaporation credit programs typically deliver annual savings of 15 to 35 percent on combined water and sewer costs. A 150,000-square-foot retail location might recover implementation costs in 18 months. A university campus system can reallocate $80,000 to $120,000 annually. In a typical single office building scenario, year-one savings clear $8,000. The numbers work because evaporation credits directly address the gap between actual water use and what utilities charge for sewer discharge.
The scenarios below are illustrative models built from typical utility rates and industry benchmarks — not reports of specific RPM client engagements.
The EPA’s WaterSense commercial water conservation programs document significant cost reductions achievable through evaporation credit and water efficiency initiatives.
Why Facility Managers Are Looking at Real Numbers Now
When you manage water costs at scale, abstract explanations don’t move the needle. You need numbers. You need to see what facilities similar to yours actually saved, understand the implementation timeline, and know whether the investment makes sense for your budget.
This post walks through four hypothetical scenarios representing the kinds of facilities RPM works with regularly. Each tells a different story. Each starts from a different baseline and reaches a different outcome. What they share is a realistic picture of how evaporation credit programs perform, how the savings are measured, and where the ROI comes from.
These are not best-case numbers. They are mid-range figures built from published utility rate structures and typical equipment performance — the kind of results a well-run program is designed to produce.
How to Read a Scenario: What the Numbers Mean
Before diving into specific facilities, let’s clarify what you’re looking at.
Baseline water cost: This is what the facility was paying before any intervention. It includes both water supply charges and sewer discharge fees.
Evaporation volume: The amount of water lost to evaporation in cooling towers, chillers, or other recirculating systems. This water never enters the sewer system, but most utilities charge for it anyway.
Implementation cost: Upfront investment in sub-metering, baseline studies, and program documentation. This varies based on system complexity and whether the facility already has partial metering in place.
Annual savings: The credit issued by the utility for documented evaporation. This is calculated monthly or quarterly based on actual consumption data.
Payback period: How long it takes for savings to equal implementation costs. Anything under two years is considered strong. Most facilities break even in 18 to 30 months.
What varies between facilities: The size of cooling systems, the utility’s evaporation credit policy, baseline sewer rates, climate (which affects evaporation rates), and the complexity of metering. Even two similar buildings in the same city can see different outcomes based on these variables.
Hypothetical Scenario 1: Large Retail Chain with Multi-Location Portfolio
Facility Overview:
Three locations in California (200,000 sq ft total)
Climate-controlled warehouse distribution center plus two retail stores
High-volume HVAC and refrigeration systems
Centralized utility management across all sites
The Situation:
This retail operator was paying combined water and sewer bills of approximately $145,000 annually across three locations. The distribution center, in particular, ran massive air-handling systems and chilled water loops to maintain temperature-controlled storage. Nobody had ever measured how much of that water actually evaporated versus what went to the sewer.
Implementation:
RPM’s team installed sub-meters on cooling loops at all three facilities and conducted a two-month baseline study. The baseline included weather data, cooling load profiles, and actual evaporation measurements. Total implementation cost: $28,000 across all three sites.
The study revealed that 22 percent of the facility’s metered water consumption was lost to evaporation. In California’s tiered rate structure, this amounted to a significant sewer charge offset opportunity.
Results:
Year 1 savings: $38,450
Payback period: 8.7 months
Ongoing annual savings: $36,000 to $42,000 (depends on weather)
ROI by end of Year 2: 155%
This retailer now budgets for a baseline water and sewer cost of approximately $103,000 annually across three sites. The evaporation credit is administered through their local water utility and updated quarterly.
Key insight: Multi-location operators often see faster payback because the implementation cost is spread across higher total water volume. The baseline study cost is amortized across three buildings rather than one.
Hypothetical Scenario 2: University Campus with Central Cooling Plant
Facility Overview:
18-building campus in the Pacific Northwest
Central chilled water plant serving academic buildings, dormitories, and administrative facilities
Approximately 1.2 million square feet
Significant seasonal variation (light cooling load in winter, peak load in summer)
The Situation:
This university paid approximately $380,000 annually for water and sewer services across campus. The facilities team knew their cooling plant used significant water for condenser cooling, but the central utility metering didn’t break out what actually evaporated versus what went to the sewer as cooling tower blowdown and drain water.
The university’s sustainability goals included reducing water consumption. An evaporation credit program offered a way to document and potentially monetize a legitimate reduction.
Implementation:
Because this was a complex central plant system, RPM conducted a more comprehensive baseline study over four months to capture seasonal variations. Specialized instrumentation was installed on cooling tower basins and condenser water lines. Total cost: $42,000.
The baseline revealed that the campus’s cooling systems evaporated an average of 18,500 gallons daily, with peak evaporation of 28,000 gallons per day during summer months.
Results:
Year 1 savings: $92,400
Payback period: 5.4 months
Ongoing annual savings: $88,000 to $115,000 (highly seasonal)
Year 3 cumulative savings: $278,000
The university reallocates this savings to additional water conservation measures, including irrigation system upgrades and landscape conversion projects. The evaporation credit documentation also supports the campus’s sustainability reporting.
Key insight: Large central systems with predictable evaporation patterns see some of the strongest ROI. Seasonal variation actually helps because the peak summer months (when evaporation is highest and cooling loads are greatest) align with when utilities have the highest sewer rates.
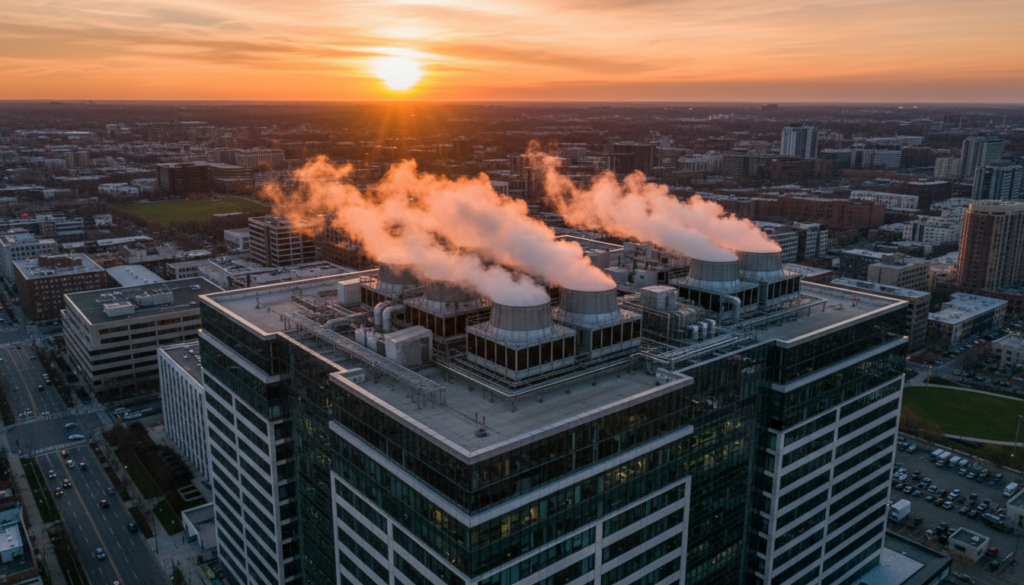
Hypothetical Scenario 3: Single Corporate Office Building
Facility Overview:
Class A office tower in Midwest metropolitan area
150,000 square feet across 12 stories
Standard HVAC system with rooftop cooling towers
Centralized building management system already in place
The Situation:
The building manager was looking for cost reductions without capital-intensive renovations. Annual water and sewer costs were approximately $32,000. The facility had no sub-metering on its cooling systems, so actual evaporation volumes were estimated but not documented.
Implementation:
RPM installed dedicated meters on the cooling tower water supply line and a two-month baseline study. Implementation was straightforward because the building already had access to its rooftop equipment and the cooling system was a single, well-maintained unit. Total cost: $9,500.
The baseline showed that 12 percent of the building’s annual water consumption evaporated from the cooling tower.
Results:
Year 1 savings: $9,800
Payback period: 11.6 months
Ongoing annual savings: $9,200 to $10,400
5-year cumulative savings: $47,000
For this building owner, the evaporation credit is now treated as a standard operational cost reduction. The metering infrastructure provides ongoing data for water management and chiller efficiency tracking.
Key insight: Even single-location buildings with modest evaporation volumes see positive ROI. The implementation cost is lower because there’s only one cooling system to meter. Payback happens within a year in most cases.
The DOE’s Federal Energy Management Program confirms that proper cooling tower management reduces both water waste and energy consumption.
Hypothetical Scenario 4: Hotel Property with Seasonal Variation
Facility Overview:
200-room hotel and conference center in Southwest region
165,000 square feet
Substantial cooling loads year-round due to climate
Peak occupancy in winter months (counter to typical Northern patterns)
On-site laundry, kitchen, and guest services adding to water demand
The Situation:
Hotel operators work on tight margins. A water and sewer bill of $28,000 annually seemed fixed and unavoidable. The property ran chilled water systems for guest comfort and kitchen operations. The general manager had heard about evaporation credits but wasn’t sure whether a hospitality property qualified.
Implementation:
RPM identified that the hotel’s chilled water loops for HVAC and kitchen equipment were a legitimate source of evaporation loss. Implementation included sub-metering on both systems and a three-month baseline study to account for seasonal occupancy patterns. Cost: $12,800.
The baseline revealed an interesting pattern: evaporation was highest during peak occupancy season (winter in this market), when cooling loads and guest laundry/dining volumes were at their maximum.
Results:
Year 1 savings: $8,600
Payback period: 17.9 months
Ongoing annual savings: $7,900 to $9,200
Year 2 cumulative savings: $18,400
For the hotel operator, this translated to a measurable reduction in operating expenses with no operational changes required. The utility’s evaporation credit program was transparent and easy to administer at the property level.
Key insight: Facilities with non-obvious water uses (guest services, laundry, kitchens) sometimes have higher total evaporation than expected. Properties with seasonal variation see stronger credits during peak periods, which aligns well with when utilities apply higher rates.
ROI comparison across four different facility types shows payback periods ranging from 5 to 18 months
Common Patterns That Predict Strong Savings
Looking across these four scenarios, several patterns emerge that indicate whether a facility will see higher or lower savings:
1. Size of cooling systems relative to total water use
Facilities where cooling represents 15 percent or more of total metered water use see the strongest ROI. Retail with HVAC, campuses with central plants, and data centers typically fall into this category. Small office buildings with minimal cooling might see evaporation of only 8 to 12 percent of water use.
2. Sewer rate structure
The larger the gap between water supply charges and sewer discharge charges, the stronger the evaporation credit. In regions where sewer costs are 40 to 50 percent of combined water and sewer bills, credits are more valuable. In regions where sewer is charged as a flat rate or at parity with water, the credit is still meaningful but slightly lower.
3. Utility receptiveness to evaporation credits
Some utilities have formal, transparent evaporation credit programs. Others are open to them but require custom engineering studies. The ease of administration affects implementation cost. The four scenarios above all assume utilities with established, transparent programs, which is why the modeled payback periods are relatively short.
4. Existing metering infrastructure
Facilities that already have sub-metering on major systems see lower implementation costs. Those requiring new meter installation see higher upfront investment but equally strong long-term savings.
5. Climate and cooling load patterns
Warm or hot climates see higher absolute evaporation volumes. But the university scenario shows that even temperate climates yield meaningful savings when the cooling system is large relative to the building’s total water use.
To be clear — all of the above scenarios are hypothetical models, not reports of actual client engagements.
Learn more about how evaporation credits work in practice: how RPM monitoring works, water monitoring ROI, and qualifying for sewer credits.
RPM Water Equity Solutions helps commercial facilities recover money lost to sewer billing assumptions. If your building has a cooling tower, chiller, or any system where water doesn’t return to the sewer, you may be overpaying every month.
Request your free assessment today and find out how much you could recover.
Mark Mason
Mark Mason writes about commercial water management, sewer credits, and cooling tower operations for RPM Water Equity Solutions. RPM helps commercial buildings stop paying sewer charges on water that never reaches the sewer — recovering credits through submetering, evaporation credit programs, and 24/7 water monitoring, backed by 200+ utility partnerships across 36 states.