How Much Water Does a Cooling Tower Waste? Rules of Thumb and Real Numbers
Quick answer for busy professionals:
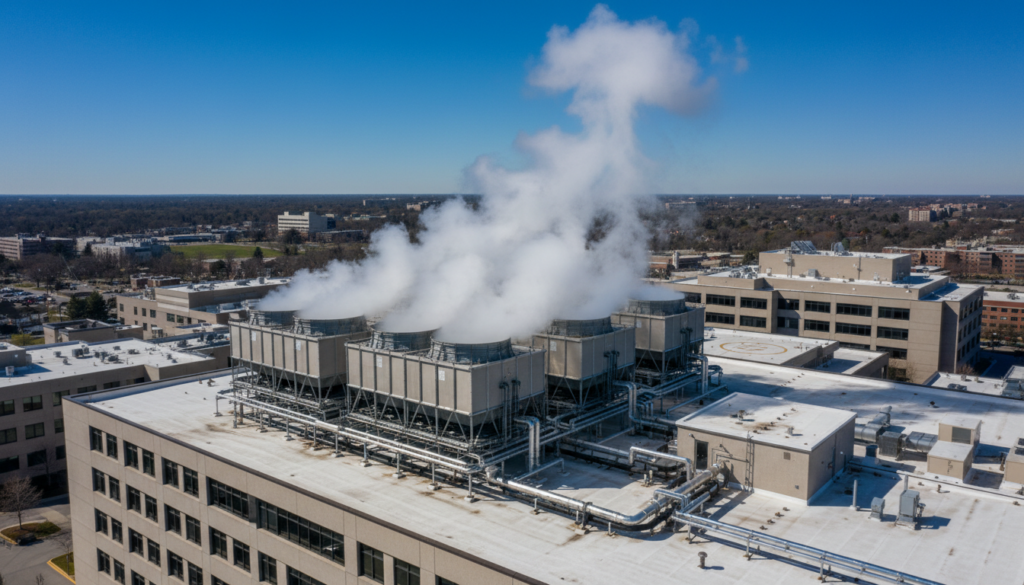
Cooling towers consume substantial water, but the amount varies widely depending on equipment size, climate, and how many hours the system runs. Yet most facility managers do not have a clear picture of how much water their cooling tower actually uses. They may have a general sense that the number is large, but without specific data, the opportunity to reduce water loss and claim sewer credits remains invisible.
This post walks through the calculation methods, provides rule of thumb formulas that facility teams can use right now, explains what is normal consumption versus what is preventable waste, and shows how to translate consumption data into financial impact.
This post builds on our earlier discussion of cooling tower water loss, which explains where the water goes conceptually. Here we focus on quantities: how much water enters the system, how it is split between evaporation and blowdown, and what happens when things go wrong.
The Basic Calculation: Tonnage, Climate, and Cycles of Concentration
Cooling tower water consumption is driven by four key factors. Understanding each one makes consumption estimates reliable and actionable.
1. Tower Tonnage (Equipment Size)
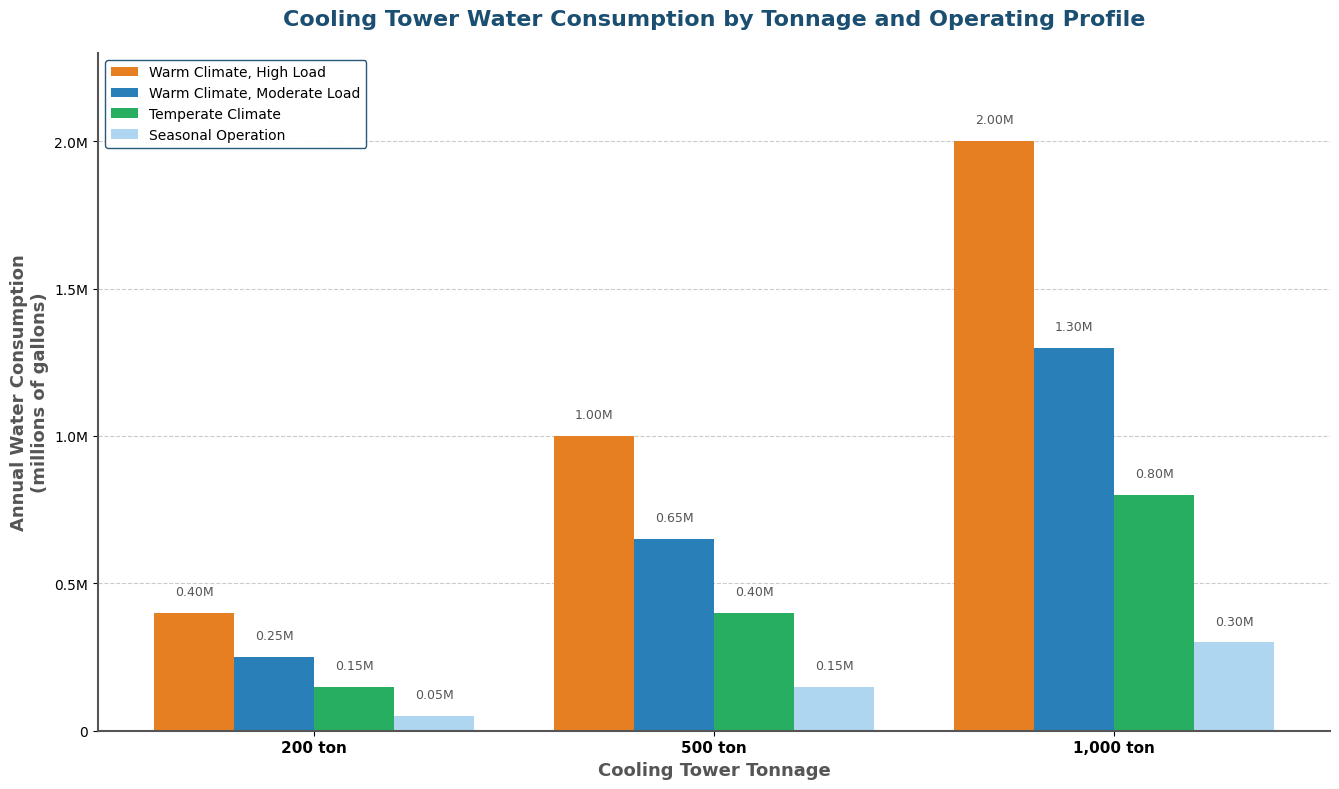
Tonnage describes the heat removal capacity of the cooling tower. A 500 ton tower removes 500 tons of heat per hour. More tonnage means more water circulates through the tower, which means more water is available to evaporate. Consumption scales roughly linearly with tonnage: a 1,000 ton tower uses approximately twice as much water as a 500 ton tower operating under the same climate and load conditions.
2. Climate (Ambient Wet Bulb Temperature)
The ambient wet bulb temperature is the single largest driver of evaporation rate. Wet bulb temperature combines air temperature and humidity. Lower wet bulb (cooler, drier air) makes it easier for water to evaporate, which means the tower needs more makeup water. Higher wet bulb (hotter, more humid air) reduces the evaporative cooling effect, which means the tower requires more water to achieve the same cooling. A cooling tower in Phoenix uses substantially more water than an identical tower in Seattle, even at the same tonnage and load.
3. Operating Load (Runtime and System Demand)
Most cooling towers do not run at full capacity all year. A 500 ton tower running at 50 percent load consumes half the water of the same tower at full load. Office buildings run their cooling systems at high load during summer and lower load during shoulder seasons and winter. Data centers may run continuously at high load year round. Understanding the typical operating profile of your building is essential to estimating consumption accurately.
4. Cycles of Concentration (Water Hardness and Cooling Tower Chemistry)
Cycles of concentration is a measure of how many times mineral content is concentrated in the circulating water before it must be removed through blowdown. A tower operating at five cycles of concentration removes one unit of water through blowdown for every five units of evaporated water. Higher cycles mean less blowdown, which reduces total water consumption. Most commercial towers operate at four to six cycles. Cycles of concentration is controlled by water treatment chemistry and is outside the scope of this post, but it matters for the calculation.
The CDC’s guidance on Legionella and cooling towers underscores why proper water treatment and drift control are critical for public health.
Rule of Thumb: The Quick Calculation You Can Do Right Now
For a rough estimate, facility teams can use this formula.
The 1.8 gallons per hour per ton figure is conservative and assumes typical office building operation in a temperate to warm climate. It accounts for the combined flow through the tower minus typical evaporation and blowdown losses. Real consumption varies based on the specific factors above, but this formula provides a reasonable starting point.
For buildings with high runtime (data centers, hospitals, continuous HVAC), use a higher hourly rate: 2.0 to 2.2 gallons per hour per ton. For seasonal or partial load operation, use 1.5 gallons per hour per ton. The accuracy improves when you know your actual operating hours and average load percentage, but even a rough estimate with this formula is more useful than no estimate at all.
Where the Water Goes: Evaporation, Blowdown, and Everything Else
Once water enters a cooling tower, it splits into several pathways.
Evaporation: The dominant pathway. Water evaporates from the fill and basin, carrying heat away. At five cycles of concentration, evaporation typically accounts for 80 percent of total water consumption. Evaporation is not waste; it is the mechanism by which the tower cools the water. Without evaporation, there is no cooling.
Blowdown: To prevent mineral scale buildup, a portion of circulating water is intentionally removed from the system and discharged to the sewer. At five cycles of concentration, blowdown represents approximately 20 percent of total makeup water. This water does reach the sewer and counts toward sewer charges.
Drift: A small percentage of circulating water is carried away as fine droplets entrained in the exhaust air stream. Modern cooling towers have drift eliminators that limit this to less than 0.005 percent of recirculation flow. Drift losses are negligible in modern equipment.
The sum of evaporation, blowdown, and drift equals the total makeup water the tower needs to maintain circulation. For a facility planning a sewer credit application, this breakdown matters because blowdown is the only portion that reaches the sewer. Evaporated water, which is typically 75 to 85 percent of total makeup water, does not enter the sewer and is eligible for a sewer credit.
The Department of Energy’s Best Management Practice #10: Cooling Tower Management details how cooling towers consume water through evaporation, drift, and blowdown.
Normal Losses vs. Preventable Waste: What the Numbers Tell You
Not all cooling tower water loss is functional. The gap between normal consumption and excessive consumption reveals equipment problems and operational issues that reduce efficiency and increase costs.
Signs of Normal, Healthy Operation
Evaporation within expected range: For a given climate, tonnage, and load, evaporation should be consistent month to month. Large month-to-month variations suggest a problem.
Blowdown proportional to makeup: The ratio of blowdown to makeup water should reflect the tower’s cycles of concentration. A tower operating at five cycles should remove roughly 20 percent of makeup water as blowdown. Higher blowdown percentages suggest either lower cycles (water chemistry problem) or a leak.
Fill condition: If the fill is clean and in good condition, evaporation will match calculations. If the fill is fouled or degraded, actual evaporation may be lower than expected, and makeup water consumption rises without corresponding cooling benefit.
Signs of Preventable Waste
Stuck fill valve: If the makeup water isolation valve does not fully close, water continuously enters the tower and flows directly to blowdown without evaporating. A single stuck valve can waste 5,000 to 20,000 gallons per day. This is the most common cause of unexpected water loss.
Continuous blowdown: Blowdown should occur through timed cycles or via a conductivity controller that stops blowdown when water quality is acceptable. If blowdown runs continuously regardless of need, consumption rises without benefit.
Leaks in piping: A small leak in makeup water piping or in the tower basin can slowly drain thousands of gallons before detection. Wet spots around the tower base, dripping water, or unexplained consumption increases suggest a leak.
Oversized tower or low cycles: A cooling tower that is oversized for the load, or one operating at low cycles of concentration due to water chemistry drift, may consume more than necessary. Correcting water chemistry or upgrading cooling controls improves efficiency.
The distinction between normal and preventable loss is crucial for operational management and for sewer credit applications. Utilities recognize that normal evaporative loss is not waste and do not question it. They do question unexplained consumption increases or data patterns that suggest equipment failure.
Cooling Tower Water Usage Monitoring: How Metering Reveals Normal vs. Excessive Loss
Without metered data, the difference between normal and wasteful consumption remains invisible. With metering, the pattern becomes clear. Implementing cooling tower efficiency monitoring transforms facility operations by providing real-time visibility into water use patterns.
Makeup water meter: Measures all water entering the cooling tower. Tracks changes in consumption by hour, day, or season. Sudden spikes suggest equipment failure or leak.
Blowdown meter: Measures water leaving the tower to the sewer. Compares blowdown volume to makeup volume. Disproportionately high blowdown relative to makeup indicates a leak or stuck fill valve.
Building water meter: Tracks total facility water consumption including cooling tower makeup, domestic use, irrigation, and other systems. Isolating the cooling tower’s consumption requires submetering, but the building meter provides validation that the submeter is accurate.
Metered data transforms facility teams from guessing about water consumption to knowing it. Teams that monitor their cooling tower water use catch problems early, optimize operations, and can document the baseline consumption needed to support a sewer credit application.
For more detail on monitoring infrastructure and how metering supports credit applications, see our guide to submetering for sewer credits.
Financial Impact: What the Numbers Mean in Dollars
Understanding water consumption is the first step. Translating consumption into financial impact is the second.
A 500 ton cooling tower consuming 1.5 million gallons per year at typical evaporation rates means approximately 1.2 million gallons annually never reach the sewer. If the local sewer rate is three dollars per thousand gallons (a reasonable midrange estimate), the credit opportunity is approximately 3,600 dollars per year. For facilities paying higher sewer rates, the number is substantially larger.
Sewer rates vary widely by geography: rural systems may charge under one dollar per thousand gallons, while major metropolitan utilities charge five to eight dollars per thousand gallons or more. A facility in a high rate jurisdiction with multiple non-sewer water uses (cooling tower, irrigation, boiler) can save tens of thousands of dollars annually by properly documenting and claiming sewer credits.
The financial case for metering and sewer credits typically shows payback within the first year, with ongoing savings in subsequent years. For midsize and larger facilities, the business case is robust.
Building the Business Case: From Consumption Data to Action
Once you know your cooling tower consumption, the next step is building a financial case for metering and sewer credits.
Step 1: Estimate the Non-Sewer Volume
Use the rule of thumb formula or actual meter readings to estimate how much water does not enter the sewer. For cooling towers, assume 80 percent of makeup water is evaporated and does not reach the sewer.
Step 2: Identify the Local Sewer Rate
Contact your local utility or review your water bill to find the current sewer charge per thousand gallons. Use the higher of the current rate and an estimate for rate growth (typically 2 to 3 percent annually).
Step 3: Calculate the Annual Savings Opportunity
Non-Sewer Volume (gallons) × Sewer Rate ($/1000 gallons) = Annual Savings. A 500 ton tower using 1.5 million gallons per year with 1.2 million gallons evaporated, at a three dollar sewer rate, yields 3,600 dollars per year in sewer credits.
Step 4: Estimate Metering Costs
A basic metering installation for a cooling tower (makeup meter and blowdown meter) typically costs two to five thousand dollars, depending on local labor costs and piping configuration. Include costs for meter purchase, installation, and integration with building systems if required.
Step 5: Calculate Simple Payback
Simple Payback (years) = Metering Cost ÷ Annual Savings. A five thousand dollar installation cost divided by 3,600 dollars in annual savings equals approximately 1.4 years. After that period, all savings flow to the bottom line.
For most commercial facilities with cooling towers, the payback is less than two years, making the investment straightforward to justify. For facilities in high-rate jurisdictions or with multiple non-sewer uses, payback is often under one year.
Getting Started: How to Optimize Cooling Tower Water Usage—Three Practical Next Steps
First: Estimate Your Current Consumption
Use the rule of thumb formula with your cooling tower tonnage and approximate operating hours. Do not aim for precision at this stage. The goal is a rough order of magnitude: are we talking about one million gallons per year, or ten million? This narrows the savings opportunity and tells you whether pursuing metering and credits makes sense.
Second: Identify Your Local Sewer Rate
Pull a recent water bill and find the sewer charge per unit of consumption. If your utility does not make this explicit, contact the billing department. Most utilities are responsive to rate inquiries. Once you know the rate, multiply it by the non-sewer volume (roughly 80 percent of cooling tower makeup water) to get a preliminary savings estimate.
Third: Assess Your Cooling Tower’s Condition
Walk around the cooling tower. Look for visible leaks, wet spots, dripping water, or crumbling fill. Note whether the system has a modern blowdown controller or appears to be running continuous blowdown. Ask your HVAC contractor when the fill was last replaced. If the system is in poor condition, fixing it before metering installation makes sense. If it is in reasonable condition, move ahead with metering planning.
The RPM Water Equity Solutions savings calculator automates these three steps and shows you the financial opportunity based on your location and equipment specifics. If you want a more thorough analysis or help planning the actual metering installation, a free evaluation is the next step.
Why This Matters Beyond Just Sewer Credits
Understanding cooling tower water consumption is valuable even if your facility does not pursue sewer credits. The same data that proves non-sewer water use to a utility also reveals equipment condition and operational efficiency to building management.
A maintenance team that monitors cooling tower consumption catches leaks before they become serious, identifies stuck valves that waste water and money, and detects fill degradation that reduces cooling efficiency. A facility manager that tracks consumption over years can show when a major system upgrade is warranted by declining efficiency. These operational insights compound over time and often pay for the metering investment many times over in maintenance savings and extended equipment life.
Water is increasingly recognized as a resource under stress in many regions. Reducing consumption not only makes financial sense but also supports corporate sustainability goals and environmental responsibility. Cooling towers are often the largest single user of water in commercial buildings. Managing that use responsibly is good business and good stewardship.
Ready to Find Out What You Could Save?
RPM Water Equity Solutions helps commercial facilities recover money lost to sewer billing assumptions. If your building has a cooling tower, chiller, or any system where water doesn’t return to the sewer, you may be overpaying every month.
Request your free assessment today and find out how much you could recover.