Water Monitoring ROI: Real Numbers
Quick Answer For Busy Professionals:
If you manage a commercial property and have never run the math on water monitoring ROI, your finance team is probably sitting on five or six figures in annual savings without realizing it. The opportunity is not theoretical. It is embedded in the way utilities bill for sewer service, and it is there for any building with cooling towers, irrigation, process water, or boilers.
This post walks through real numbers: what investment looks like, what savings actually range from, how long the payback takes, and what the cost of inaction looks like over time. We will show you how to build the internal business case, address common objections from finance teams, and understand the ongoing management costs that determine whether a program delivers sustained value.
For broader context on why utilities bill the way they do, see our post on utility billing assumptions versus reality.
What Water Monitoring ROI Actually Measures
Before diving into numbers, it helps to be clear about what we are measuring. Water monitoring ROI is not about cutting water consumption (though that sometimes happens as a side benefit). It is about recovering billing credits on water that the building is already using but paying sewer charges for incorrectly. This is the foundation of commercial water efficiency improvements: measuring actual water use to correct billing errors.
The EPA WaterSense program estimates that commercial buildings can reduce water use by 20 percent or more through monitoring and efficiency upgrades.
Credit recovery. The primary source of savings is sewer charge reduction on non-sewer water uses. A building that evaporates 2 million gallons per year in cooling towers but is billed as if all 2 million gallons went to the sewer can recover credits on that entire volume. At $10 per thousand gallons of sewer charge, that is $20,000 per year in billing correction. That is not new savings. It is recovering money the building was already spending.
Leak prevention. Once submeters are installed and monitored, they catch problems early. A stuck fill valve on a cooling tower can waste thousands of gallons per week. A slow leak in a makeup water line can run undetected for months. Early detection prevents these losses from compounding, protecting both water consumption and sewer volume. The savings here are real consumption reductions, not billing corrections.
Operational optimization. Some buildings discover through monitoring that their cooling tower cycles of concentration are running at 2x when they could safely run at 3x. Some irrigation systems are watering more frequently than necessary. These are efficiency gains that metering surfaces. The savings depend on whether management acts on the data.
The biggest component of ROI is almost always credit recovery. That is why the payback is fast: you are not waiting for consumption changes to accumulate. You are recovering money on day one, once the utility approves the credit application.
Savings Ranges By Program Component
The size of the opportunity depends on which systems the building operates and how much water they consume. These commercial utility savings components typically stack to create substantial annual recovery. Here is how the pieces break down:
Cooling Tower Evaporation Credits
Cooling towers reject heat by evaporating water. The evaporated volume never reaches the sewer but is currently billed as if it does. A midsize office tower with a 500 ton cooling system typically evaporates one to three million gallons per year, depending on climate, operating hours, and tower design. At sewer rates of $5 to $15 per thousand gallons, that translates to $5,000 to $45,000 per year in billing corrections. Large campuses with multiple cooling systems can easily exceed $100,000 per year in cooling tower credits alone. This is one of the primary ways to lower cooling tower water costs through proper billing accountability.
Irrigation and Landscape
Irrigation water goes directly into the soil and landscape, never reaching the sewer. Office parks, hospitals, universities, and retail properties with significant landscaping can use 50,000 to 200,000 gallons per year on irrigation during the growing season. Depending on sewer rates, this can be worth $250 to $3,000 per year. It is typically a smaller component than cooling tower savings, but it accumulates into meaningful commercial water and sewer cost reduction when combined with other non-sewer uses.
Boiler and Steam System Makeup Water
Boilers consume water in the form of steam. Steam vented to the atmosphere or lost through the distribution system never returns to the sewer. Facilities with large heating plants can have substantial makeup water volumes, especially in northern climates. This is rarely the dominant source of savings, but in industrial facilities or buildings with extensive process heating, it can contribute meaningfully.
Metering and Monitoring Investment
Submeter installation typically costs $4,000 to $15,000 depending on the number of systems being metered and the complexity of the piping configuration. Engineering documentation for the credit application adds $2,000 to $8,000. The utility application and approval process is typically managed as part of the engagement and does not require separate fees. Once approved, the building pays for ongoing compliance, which is minimal but important (see section below on ongoing management costs).
Payback Period Analysis With Example Scenarios
Payback is the most compelling metric for finance teams. It answers the question: when do we break even on this investment? The answer for water monitoring is almost always faster than six months.
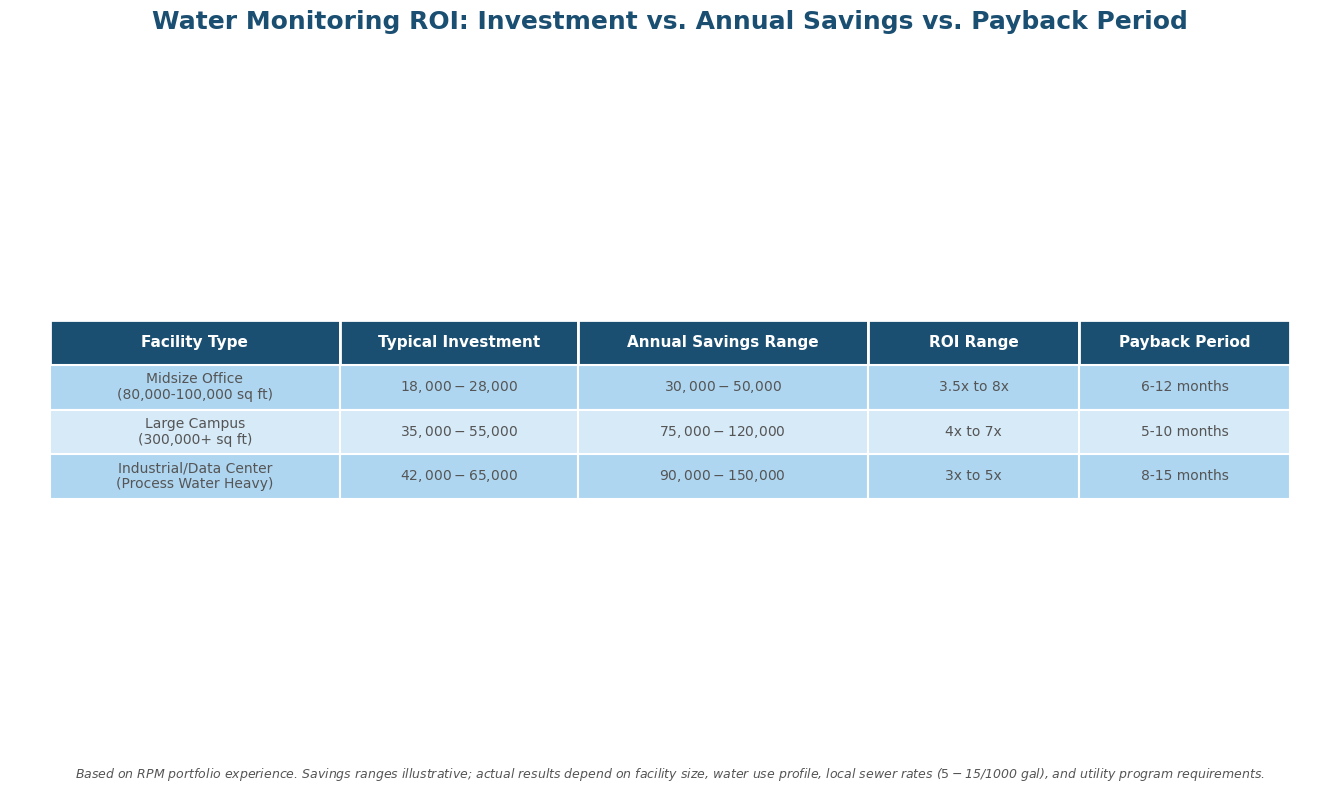
Scenario One: Midsize Office Building
A 100,000 square foot office tower in an urban market has a 500 ton cooling tower, some irrigation, and boiler makeup water. The building consumes approximately 4 million gallons per year. About 20 to 25 percent of that (800,000 to 1 million gallons) bypasses the sewer. At a sewer rate of $9 per thousand gallons, that is $7,200 to $9,000 per year in potential credits. The utility application shows 900,000 gallons of non-sewer water at an average of $9 per thousand gallons, or $8,100 per year in annual savings. Investment in submetering and documentation is $6,000. Payback is approximately nine months, or about 8 percent of the annual savings recovered in the first month.
Scenario Two: Large Campus
A university or hospital campus spans 300,000 to 400,000 square feet with multiple buildings, cooling systems, irrigation, and process water. The facility consumes 12 to 15 million gallons per year, with 30 to 40 percent non-sewer water use. That can total 4 to 6 million gallons of non-sewer water annually. At sewer rates of $8 to $12 per thousand gallons, annual savings can range from $32,000 to $72,000. The investment for metering and documentation across multiple buildings is higher: approximately $45,000 to $65,000. Payback is typically 8 to 12 months. The larger absolute savings offset the higher investment cost.
Scenario Three: Industrial Facility With Heavy Process Water Use
A manufacturing facility, data center, or food production plant has substantial process water that is either evaporated, recycled, or discharged directly rather than through the sewer. Total water use can be 20 to 40 million gallons per year, with 40 to 60 percent non-sewer, depending on facility type and sewer rates. At typical rates of $8 to $12 per thousand gallons, annual savings can reach $80,000 to $200,000 from non-sewer water credits. The investment is proportionally larger due to multiple metering points: $50,000 to $70,000. Payback is typically 5 to 12 months depending on the facility’s specific water use profile and local rates. The high absolute savings make the business case compelling, but these facilities are also more likely to require ongoing engineering support to maintain the credit.
Across all facility types, the pattern is consistent: payback within six to eighteen months. Once paid back, the annual savings continue indefinitely (subject to ongoing compliance requirements).
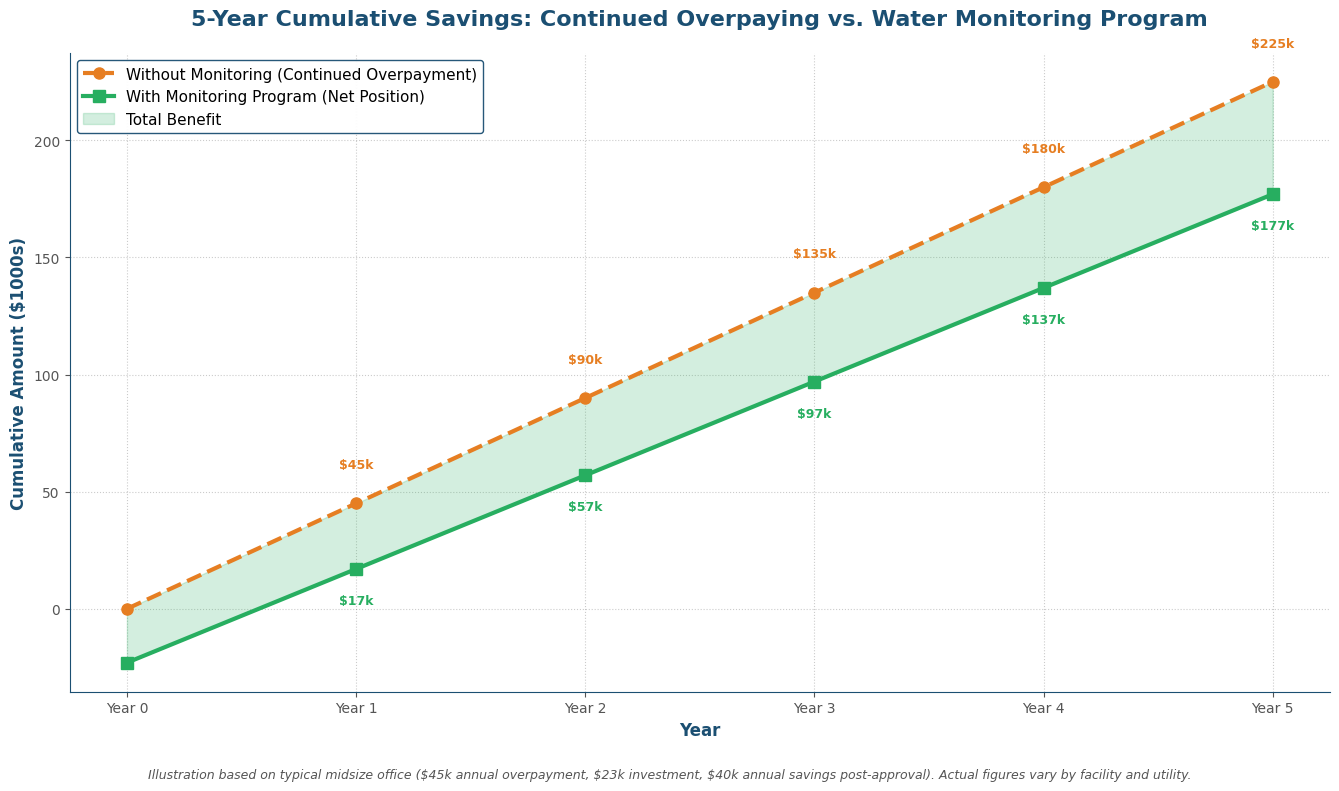
Cost of Inaction: What Continued Overpayment Looks Like Over Time
If the ROI is so clear, why does any facility continue overpaying? Usually because the opportunity was never quantified. Decision makers do not know the money is on the table. Inaction is not a choice. It is the default.
Here is what the math looks like if a facility with $40,000 per year in recoverable credits chooses not to act:
Three years of inaction: $120,000 lost to overpayment. That is $120,000 in utility charges on water the building did not actually send to the sewer, divided across 36 monthly bills with no one noticing.
Five years of inaction: $200,000 lost. If the facility had invested $25,000 and captured the savings, five years would have delivered $175,000 in net benefit. Choosing not to act costs the equivalent of the entire investment four times over.
Ten years of inaction: $400,000 lost. Over ten years, implementing the program would have yielded $375,000 in net benefit (annual savings of $40,000 less the $25,000 upfront investment). The cost of waiting is approximately $375,000 in foregone value.
These numbers compound across multiple facilities. A company with 10 properties, each with $30,000 to $50,000 per year in potential savings, is leaving $1.5 million to $2.5 million on the table if it takes no action over five years.
How to Build the Internal Business Case
Getting internal approval requires translating the opportunity into language that resonates with the finance team and executive sponsors. Here is the structure that works:
1. Start With The Quantified Opportunity
Do not propose a program in the abstract. Lead with a number. Example: ‘Our utility analysis identified $38,000 in annual overpayment on sewer charges due to non-sewer water uses that our cooling towers and irrigation systems account for. This is a billing correction, not a consumption reduction. We are already spending this money; we are just paying it to the wrong category.’
2. Present the Investment and ROI
To recover this $38,000 annually, we need to install submeters and submit a sewer credit application with the utility. The total investment is $22,000 for metering, engineering, and application management. This delivers a 1.7x return on investment in year one, with 7.2 month payback. Every year after that, we capture the full $38,000 with no additional investment.
The DOE’s Better Buildings Solution Center documents measurable savings from water efficiency investments in commercial facilities.
3. Address Risk Explicitly
Finance teams will ask: What if the utility denies the application? What if conditions change? What if the meters fail? ‘The utility application is based on a professional water audit and metered evidence. The program is established at this utility; they have approved similar applications from other commercial properties. In the unlikely event of denial, the cost is the $22,000 investment with no recovery. If approved, the downside is contained and the upside is $38,000 per year indefinitely.’
4. Emphasize The Lack of Operational Change Required
‘This program does not require changes to how we operate the building, changes to tenant agreements, or changes to capital budgets. We continue using water exactly as we do now. We simply correct the billing to reflect the actual use. This is a pure finance win.’
5. Show The Cumulative Benefit Over Time
In year one, we invest $22,000 and capture $38,000 in savings for a net gain of $16,000. Over five years, assuming no operational changes and no inflation, we recover $190,000 in total credits against a one-time investment of $22,000. That is $168,000 in net benefit, or approximately 763 percent return over five years.
What Ongoing Management Costs Look Like and Why They Matter
Once the credit is approved, the savings do not come automatically. They require ongoing attention. Most facilities underestimate this, and some credits lapse or atrophy as a result.
Meter reading and data collection. Submeters must be read regularly, typically monthly or quarterly depending on the utility’s requirements. Some facilities read meters manually; others have automated data loggers that transmit readings remotely. Manual reading adds 2 to 4 hours per quarter to facility staff. Automated reading costs $200 to $400 per year per meter. The data must be complete and consistent.
Annual compliance and revalidation. Most utilities require annual documentation renewal. This typically involves submitting a form, current meter readings, and a certification that the non-sewer water use remains unchanged. For a simple cooling tower credit, this can be done in-house in 1 to 2 hours per year. For complex multipoint metering, it may require professional engineering support, adding $1,000 to $3,000 per year.
Billing verification. Credits are often applied manually by utility billing staff. It is not uncommon for a credit to be omitted from a single bill, applied to the wrong account, or calculated incorrectly. Someone needs to review the sewer line item each month to ensure the credit is being applied. This takes 15 to 30 minutes per month, or 3 to 6 hours per year.
Meter maintenance and calibration. Water meters require periodic maintenance and recalibration to remain accurate. Industry standards typically call for recalibration every three to five years. Costs depend on meter type and location but generally run $300 to $800 per meter per occurrence.
Total ongoing costs typically range from $200 to $500 per month, depending on the number of systems being metered, whether monitoring is automated or manual, and whether professional engineering support is retained. For a facility capturing $35,000 per year in annual savings, ongoing costs of $3,000 to $6,000 per year reduce the net benefit to $29,000 to $32,000. The ROI is still compelling, but the ongoing cost structure matters.
This is a primary reason many facilities work with specialized firms for credit program management. The firm assumes the responsibility for compliance, meter reading, data verification, and revalidation. The facility pays a percentage of savings (typically 20 to 30 percent) and delegates the complexity. For a facility capturing $40,000 per year, paying 25 percent of savings ($10,000) to avoid the operational headache is often a reasonable trade.
Common Objections From Finance Teams and Honest Answers
Objection One: This Sounds Like Too Good to Be True
Answer: It is only good if the utility agrees. The savings are real (the building is already overpaying), but they are conditional on utility approval of the credit application. That said, sewer credit programs are established at most major U.S. utilities, and credit applications for cooling towers and process water are commonplace. This is not a new or exotic strategy. It is a standard billing correction.
Objection Two: What If the Utility Changes the Rules or Denies the Application
Answer: Utility program rules can change, but retroactively revoking approved credits is rare. If a credit is approved, it is typically honored indefinitely subject to annual revalidation. Denial of an application is possible, but uncommon for straightforward cases with metered evidence. If denial occurs, the financial downside is limited to the investment cost. If approval is likely, the upside is worth the risk.
Objection Three: We Do Not Have Time to Manage This
Answer: Correct. That is why most midsize to large facilities work with a specialized firm. You pay a percentage of savings (20 to 30 percent) in exchange for handling all compliance, meter reading, utility communications, and revalidation. It is still a net positive even after the fee.
Objection Four: Our Facility Is Small. The Savings Probably Will Not Justify the Investment
Answer: Small facilities have lower absolute savings, but the payback is still fast. A 30,000 square foot building with a 200 ton cooling tower might have $10,000 to $15,000 per year in potential savings and a $15,000 investment. Payback is 12 to 18 months. The bar for investment is lower for smaller buildings, and if the meter cost can be kept under $10,000, the case still works. That said, below a certain size (typically 20,000 to 25,000 square feet), economies of scale disappear and the payback may stretch beyond 18 months. Professional evaluation is the only way to know for sure.
Objection Five: Our Utility Does Not Have a Sewer Credit Program
Answer: If your utility has not formalized a program, a credit application may still be possible through the utility’s general customer service or billing adjustment process. Many utilities handle non-sewer water use adjustment on a case-by-case basis even if there is no formal program. The utility will evaluate the application based on whether the non-sewer use is genuine and whether documentation is sufficient. It is worth investigating before assuming the door is closed.
How This Connects to Broader Water Optimization
Water monitoring ROI is one piece of a larger picture. If you have not already, read our post on how much you might be overpaying for sewer service to understand the billing issue in detail. You might also find value in our breakdown of where cooling tower water goes and how much it typically costs.
Next Steps
The numbers above are based on RPM portfolio experience and are intended to be illustrative, not guarantees. Your facility’s actual ROI depends on facility size, water use profile, local sewer rates, and utility program specifics. The only way to know for certain is to run your own analysis on your actual utility data.
RPM’s savings calculator lets you input your facility data and generate an estimate of potential savings specific to your situation. If you prefer a professional analysis, our free executive-level assessment reviews your utility data and tells you whether the opportunity justifies further investigation. Either way, the first step is quantifying what you might recover.
Technical Resources and References
For deeper technical context on water metering and utility billing standards:
AWWA (American Water Works Association) Standards on Meter Installation and Accuracy
U.S. EPA Commercial Buildings Water Efficiency Guidance
U.S. DOE Water Management Resources
Ready to Find Out What You Could Save?
RPM Water Equity Solutions helps commercial facilities recover money lost to sewer billing assumptions. If your building has a cooling tower, chiller, or any system where water doesn’t return to the sewer, you may be overpaying every month.
Request your free assessment today and find out how much you could recover.